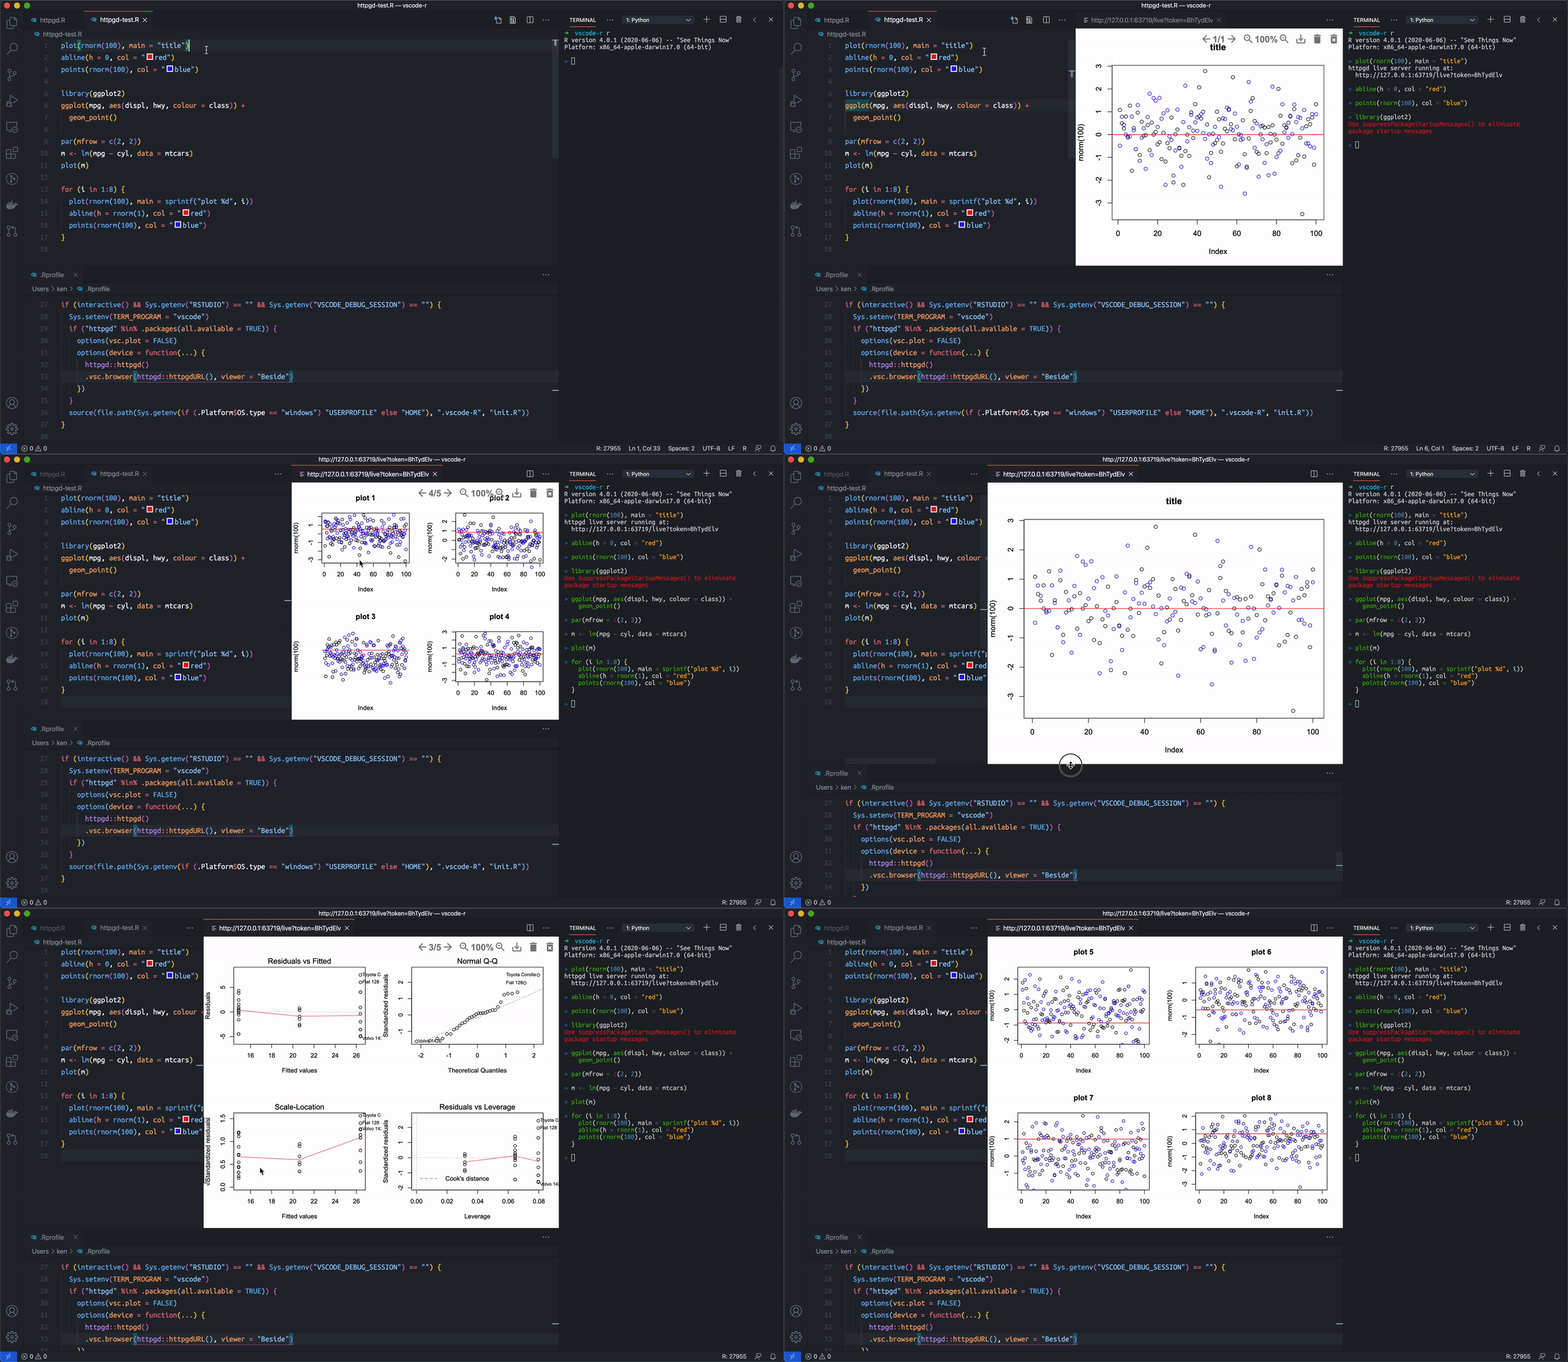
Showing graphics produced by R in external code editors (e.g. VSCode) could be hacky. First, we need to overwrite the default graphics device so that calling plot does not immediately result in a new window we have no control. Instead, we use a pdf(NULL) device that is virtual and can be used to replay user produced graphics in another file-based device (e.g. png(file)) if we enable dislaylist:
options(
  device = function(...) {
    pdf(NULL, bg = "white", ...)
    dev.control(displaylist = "enable")
  }
)
Then the only thing we need is to know when user creates a new plot or updates an existing plot. Fortunately, we would be notified a new plot is being created by setting up some hook functions like the following:
setHook("plot.new", new_plot)
setHook("grid.newpage", new_plot)
With the hooks applied, running the following code
plot(rnorm(100))
will call new_plot() so that we know a new plot is being created.
Unfortunately, adding graphics elements to an existing plot does not expose such hooks. For example, if we add a line to the scatter plot previously created like the following
abline(h = 0, col = "blue")
then we won’t get noticed by any callback. In this case, if we don’t implement a graphics device from scratch at C level, there seems to be no decent way for us to know if the current graphics is updated. To avoid writing any C/C++ code to serve as a complete graphics device, I use a hack in vscode-R session watcher script by replacing base::.External.graphics with the following function:
function(...) {
  out <- .Primitive(".External.graphics")(...)
  if (check_null_dev()) {
    plot_updated <<- TRUE
  }
  out
}
Note that all graphics functions that add elements to the plot ultimately calls this function. It is obviously hacky but has been working well for me so far.
Now that we know a plot is being created or updated, we could set up a callback for any top-level user input with
update_plot <- function(...) {
  tryCatch({
    if (plot_updated) {
      plot_updated <<- FALSE
      record <- recordPlot()
      if (length(record[[1L]])) {
        png(filename = plot_file)
        on.exit(dev.off())
        replayPlot(record)
      }
    }
  }, error = message)
  TRUE
}
addTaskCallback(update_plot)
Then when user creates or update a plot, plot_updated is altered to TRUE and the task callback will be called and we could replay the graphics
recorded by the pdf(NULL) virtual device into a png file. And the code editor could watch the file and show the graphics whenever the file is updated.
Thanks to the good work done by Florian Rupprecht, all these hacky stuff could give way to the new R package httpgd: Asynchronous http server graphics device for R. The package implements a graphics device accessible via HTTP, which allows a web browser and code editors that could properly show a web page with background communication with a running HTTP server to provide the graphics. In VSCode, the WebView is a good way to show the R graphics without any hacking.
The httpgd provides nice features: SVG graphics of high quality, auto-resizing, navigating plot history, zooming, delete and clear, security token (httpgd#5), and multiple viewers having independent views of the plots (httpgd#7).

Recently, I also updated vscode-R session watcher code to make it easier to control the session watcher behavior (vscode-R#359). To better use httpgd in VSCode, I suggest the following code in the .Rprofile:
if (interactive() && Sys.getenv("TERM_PROGRAM") == "vscode") {
  if ("httpgd" %in% .packages(all.available = TRUE)) {
    options(vsc.plot = FALSE)
    options(device = function(...) {
      httpgd::hgd(silent = TRUE)
      .vsc.browser(httpgd::hgd_url(), viewer = "Beside")
    })
  }
}
It disables the original simple plot watcher provided by vscode-R session watcher (which replays user graphics into a png file) and use httpgd as the graphics device and opens a new WebView tab in VSCode to show the graphics.
I also suggest adding the following keybindings to show the current httpgd window if closed:
{
  "key": "ctrl+alt+p",
  "command": "r.runCommand",
  "when": "editorTextFocus && editorLangId == 'r'",
  "args": ".vsc.browser(httpgd::hgd_url(), viewer = \"Beside\")"
}
Now the plotting in VSCode works much more smoothly than before. If you encounter any problem, please report to https://github.com/nx10/httpgd/issues so that more improvements could be done.
Updates
- All httpgd functions are renamed from e.g.
httpgdURLtohgd_urlrecently before being released to CRAN. The code in this post is updated accordingly.